

LightningChart® JS与其他 JavaScript 图表库的性能比较(一)
LightningChart® JS与其他 JavaScript 图表库的性能比较(二)
LightningChart® JS与其他 JavaScript 图表库的性能比较(三)
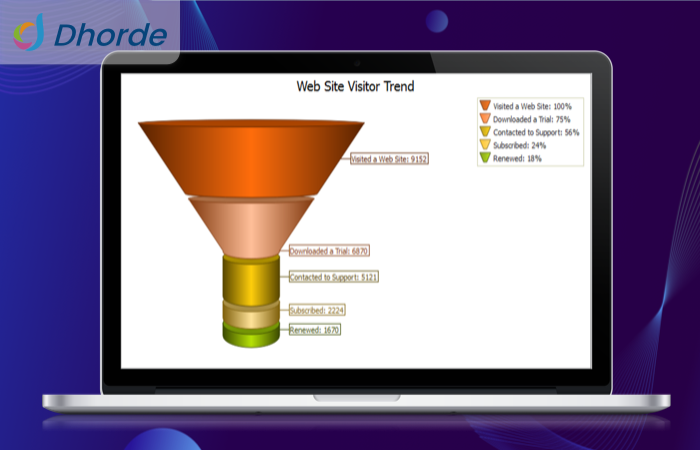
流数据性能
每个数据可视化解决方案使用和显示流数据(以非常小的时间间隔出现的数据点)的效率如何?
性能分数定义为

在下表中,您可以看到其他解决方案的性能结果与 LightningChart JS 的比较。
| Solution | Line Charts | Scatter Charts | Area Charts | Spline Charts | Step Charts |
| LightningChart JS | Best score | Best score | Best score | Best score | Best score |
| Competitor D | 500x worse | 4.2x worse | 1010x worse | 16630x worse | 340x worse |
| Competitor E | 345640x worse | 3470x worse | 413370x worse | 388950x worse | 430370x worse |
| Competitor G | 2716240x worse | 35980x worse | 2943840x worse | 2915350x worse | 2841440x worse |
| Competitor B | 6235020x worse | 112820x worse | 6304780x worse | - | 6255210x worse |
| Competitor F | 542610x worse | 4380x worse | 595640x worse | 577580x worse | 471740x worse |
| Competitor H | 432140x worse | 2070x worse | 495890x worse | 539490x worse | 373350x worse |
| Competitor J | - | 2860x worse | 390660x worse | - | - |
| Competitor A | 7911510x worse | - | 6034390x worse | 15538910x worse | 15415210x worse |
| Competitor C | 655120x worse | - | 671280x worse | 684010x worse | 665150x worse |
| Competitor I | 91720x worse | 1150x worse | 140520x worse | 197900x worse | 93760x worse |
| Competitor K | 78110x worse | - | 123770x worse | 189920x worse | 79590x worse |
| Competitor L | - | - | - | - | - |
| Competitor M | 1046960x worse | 12810x worse | 1105470x worse | 1106820x worse | - |
| Competitor N | 157190x worse | 6190x worse | 249630x worse | 267310x worse | 151570x worse |
| Competitor O | 165710x worse | 24220x worse | 379730x worse | 559370x worse | 160900x worse |
| Competitor P | 461930x worse | 14410x worse | 479390x worse | 505390x worse | 470230x worse |
| Competitor Q | 4990x worse | - | 82890x worse | 100700x worse | 5020x worse |
| Competitor R | 1688790x worse | 17230x worse | 1830610x worse | 1768800x worse | 1712910x worse |
| Competitor S | - | - | - | - | - |
| Competitor T | 87250x worse | 280x worse | 137820x worse | 163430x worse | 74020x worse |
| Competitor U | 6041910x worse | 82600x worse | 7234200x worse | 10193390x worse | 6492710x worse |
平均而言,在流数据应用程序方面,LightningChart JS 的性能比其他数据可视化解决方案高 1511700 倍。
更多信息请参考https://github.com/Arction/javascript-charts-performance-comparison?tab=readme-ov-file#more-information-about-streaming-data-performance-results
LightningChart® JS与其他 JavaScript 图表库的性能比较(一)
LightningChart® JS与其他 JavaScript 图表库的性能比较(二)
LightningChart® JS与其他 JavaScript 图表库的性能比较(三)


 渝公网安备50010702505508