


流程图是流程的直观说明。它使用一组符号,如方框、菱形和箭头,来展示每个阶段所涉及的步骤和需要做出的决定。
本文涵盖以下主题:
Python 流程图制作 API
用 Python 创建流程图
Python 流程图制作 API
Aspose.Diagram for Python 是一个库,可让程序员直接在其 Python 应用程序中创建、编辑和操作 Visio 文件。它提供了一组用于处理 Visio 文件的 API。我们将使用它在 Python 中以编程方式创建流程图。
请在控制台中使用以下 pip 命令从 PyPI 下载软件包或安装 API:
pip install aspose-diagram-python
用 Python 编程创建流程图
按照以下步骤,我们可以用 Python 轻松制作流程图:
为图表创建模式。
使用 Diagram 类加载用于添加形状的母图。
使用形状类创建形状。
使用 add_shape() 方法将形状添加到图中。
使用 connect_shapes_via_connector() 方法添加形状连接器。
使用 LayoutOptions 类设置图表布局。
然后,使用 DiagramSaveOptions 类指定保存选项。
最后,使用 save() 方法将输出文件保存为 VSDX 格式。
下面的代码示例展示了如何用 Python 创建流程图。
# This code sample demonstartes how to create a flowchart in Python.
import aspose.diagram
from aspose.diagram import *
def createFlowChart():
    # schema for the diagram to be created
    diagram_object = Input(
        input_rectangles=[
            InputRectangle("A", "Manager"),
            InputRectangle("B", "Team Leader"),
            InputRectangle("C", "Team Member"),
            InputRectangle("D", "Team Member"),
            InputRectangle("E", "Team Member")
        ],
        input_connectors=[
            InputConnector("A", "B"),
            InputConnector("B", "C"),
            InputConnector("B", "D"),
            InputConnector("B", "E")
        ]
    )
    diagram = Diagram("D:\\Files\\BasicShapes.vss")
    page = diagram.pages[0]
    shape_names = {}
    # Adding shapes and connectors from the schema
    for rectangle in diagram_object.InputRectangles:
        shape = Shape()
        shape_id = diagram.add_shape(shape, "Rectangle", 0)
        shape_names[rectangle.Name] = shape_id
        shape = page.shapes.get_shape(shape_id)
        shape.text.value.add(Txt(rectangle.Text))
    for connector in diagram_object.InputConnectors:
        connector_id = diagram.add_shape(Shape(), "Dynamic connector", 0)
        page.connect_shapes_via_connector(
            shape_names[connector.OriginShapeName],
            aspose.diagram.manipulation.ConnectionPointPlace.RIGHT,
            shape_names[connector.DestinationShapeName],
            aspose.diagram.manipulation.ConnectionPointPlace.LEFT,
            connector_id
        )
    layout_options = aspose.diagram.autolayout.LayoutOptions()
    layout_options.layout_style = aspose.diagram.autolayout.LayoutStyle.FLOW_CHART
    layout_options.direction = aspose.diagram.autolayout.LayoutDirection.LEFT_TO_RIGHT
    layout_options.space_shapes = 5.0
    layout_options.enlarge_page = True

    diagram.layout(layout_options)
    page.page_sheet.print_props.print_page_orientation.value = PrintPageOrientationValue.LANDSCAPE
    save_options = aspose.diagram.saving.DiagramSaveOptions()
    save_options.save_format = SaveFileFormat.VSDX
    save_options.auto_fit_page_to_drawing_content = True
    diagram.save("D:\\Files\\flowchart_output.vsdx", save_options)

class Input:
    def __init__(self, input_rectangles=None, input_connectors=None):
        self.InputRectangles = input_rectangles if input_rectangles else []
        self.InputConnectors = input_connectors if input_connectors else []
class InputRectangle:
    def __init__(self, name, text):
        self.Name = name
        self.Text = text
class InputConnector:
    def __init__(self, origin_shape_name, destination_shape_name):
        self.OriginShapeName = origin_shape_name
        self.DestinationShapeName = destination_shape_name

createFlowChart()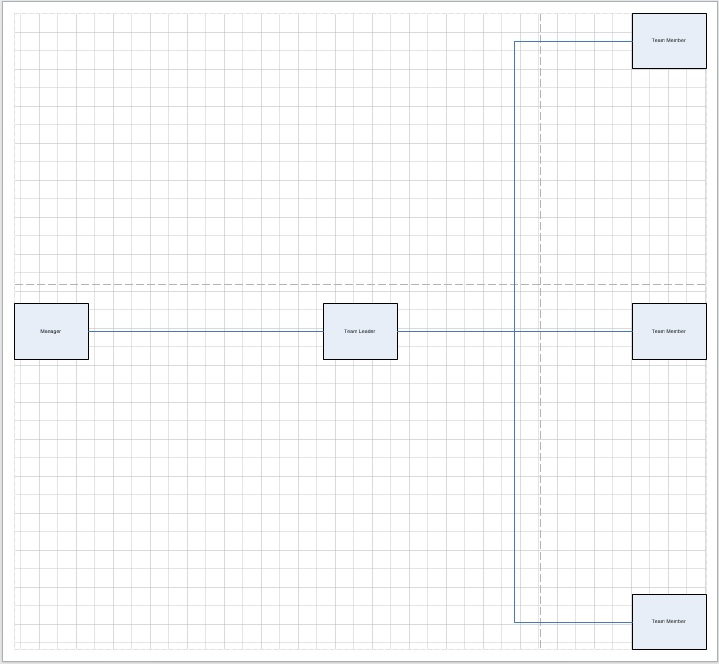
获取免费 API 许可证
您可以获得免费的临时许可证,以便在没有评估限制的情况下使用 API。
结论
在本文中,您已经学会了如何用 Python 编程创建流程图。利用 Aspose.Diagram for Python,您可以使用不同类型的形状(如决策或流程)以及不同的布局(如从左到右或从右到左等)创建各种类型的流程图。如果有任何不清楚的地方,请联系我们。


 渝公网安备50010702505508