


龙卷风图是比较数据点和可视化潜在变化的强大工具。在本文中,我们将学习如何使用 C# 在 Excel 中创建龙卷风图表。本文将通过简单易懂的说明,教您如何制作可以直接添加到应用程序中的炫酷图表和图形!
本文涵盖以下主题:
在 Excel 中创建龙卷风图表的 C# API
在 Excel 中创建龙卷风图表
在 Excel 中插入数据并创建龙卷风图表
获取免费许可证
在 Excel 中创建龙卷风图表的 C# API
Aspose.Cells for .NET是一个功能强大的应用程序接口,开发人员无需使用Microsoft Excel即可创建、处理和转换Excel文件。在其众多功能中,它提供了全面的图表功能,可在电子表格中生成和管理图表。
要利用该 API,请下载 DLL 或使用以下命令从 NuGet 安装:
PM> Install-Package Aspose.Cells
使用 C# 在 Excel 中创建龙卷风图表
现在,我们可以按照以下步骤在 Excel 工作表中轻松创建龙卷风图表:
使用工作簿类加载 Excel 文件。
在工作表类对象中获取所需的工作表。
可选择在工作表中插入数据。
使用 Charts.Add() 方法添加堆叠条形图。
通过图表类对象中的索引访问图表。
使用 SetChartDataRange() 方法设置图表的数据源。
为图表设置所需的属性。
最后,使用 Save() 方法保存文档。
以下代码示例展示了如何使用 C# 在 Excel 中创建龙卷风图表。
// Load en existing Excel file with data
Workbook wb = new Workbook("D:\\Files\\sample.xlsx");
// Access the worksheet
Worksheet sheet = wb.Worksheets[0];
// Get charts
ChartCollection charts = sheet.Charts;
// Add bar chart
int index = charts.Add(ChartType.BarStacked, 8, 1, 24, 8);
Chart chart = charts[index];
// Set data for bar chart
chart.SetChartDataRange("A1:C7", true);
// Set properties for bar chart
chart.Title.Text = "Tornado chart";
chart.Style = 2;
chart.PlotArea.Area.ForegroundColor = Color.White;
chart.PlotArea.Border.Color = Color.White;
chart.Legend.Position = LegendPositionType.Bottom;
chart.CategoryAxis.TickLabelPosition = TickLabelPositionType.Low;
chart.CategoryAxis.IsPlotOrderReversed = true;
chart.GapWidth = 10;
Axis valueAxis = chart.ValueAxis;
valueAxis.TickLabels.NumberFormat = "#,##0;#,##0";
// Save the file
wb.Save("D:\\Files\\out.xlsx");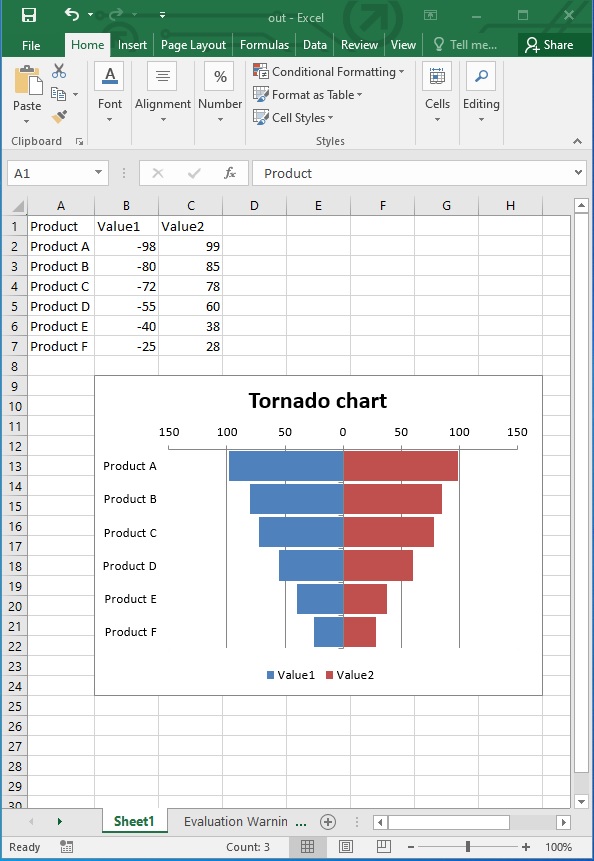
在 Excel 中插入数据并创建龙卷风图表
在上一节中,我们使用预填充数据的工作表创建了龙卷风图表。我们也可以使用单元格类的 PutValue() 方法在 Excel 工作表中插入数据。创建龙卷风图表的其余过程将保持不变。
下面的代码示例展示了如何使用 C# 在 Excel 中插入数据并创建龙卷风图表。
// Create a new Excel Workbook
Workbook wb = new Workbook();
Worksheet worksheet = wb.Worksheets[0];
// Add sample values to cells
worksheet.Cells["A1"].PutValue("Products");
worksheet.Cells["A2"].PutValue("Product A");
worksheet.Cells["A3"].PutValue("Product B");
worksheet.Cells["A4"].PutValue("Product C");
worksheet.Cells["A5"].PutValue("Product D");
worksheet.Cells["A6"].PutValue("Product E");
worksheet.Cells["B1"].PutValue("2021-2022");
worksheet.Cells["B2"].PutValue(-100);
worksheet.Cells["B3"].PutValue(-80);
worksheet.Cells["B4"].PutValue(-75);
worksheet.Cells["B5"].PutValue(-60);
worksheet.Cells["B6"].PutValue(-48);
worksheet.Cells["C1"].PutValue("2023-2024");
worksheet.Cells["C2"].PutValue(95);
worksheet.Cells["C3"].PutValue(80);
worksheet.Cells["C4"].PutValue(72);
worksheet.Cells["C5"].PutValue(65);
worksheet.Cells["C6"].PutValue(45);
ChartCollection charts = worksheet.Charts;
// Add bar chart
int index = charts.Add(ChartType.BarStacked, 8, 1, 24, 8);
Chart chart = charts[index];
// Set data for bar chart
chart.SetChartDataRange("A1:C6", true);
// Set properties for bar chart
chart.Title.Text = "Tornado chart";
chart.Style = 2;
chart.PlotArea.Area.ForegroundColor = Color.White;
chart.PlotArea.Border.Color = Color.White;
chart.Legend.Position = LegendPositionType.Bottom;
chart.CategoryAxis.TickLabelPosition = TickLabelPositionType.Low;
chart.CategoryAxis.IsPlotOrderReversed = true;
chart.GapWidth = 50;
// Show data labels
DataLabels datalabels;
for (int i = 0; i < chart.NSeries.Count; i++)
{
    datalabels = chart.NSeries[i].DataLabels;
    //Set the position of DataLabels
    datalabels.Position = LabelPositionType.Center;
    //Show the value in the DataLabels
    datalabels.ShowValue = true;
    datalabels.Font.Color = Color.White;
    datalabels.NumberFormat = "#,##0;#,##0";
}
Axis valueAxis = chart.ValueAxis;
valueAxis.TickLabels.NumberFormat = "#,##0;#,##0";
// Save the file
wb.Save("D:\\Files\\chart_out.xlsx");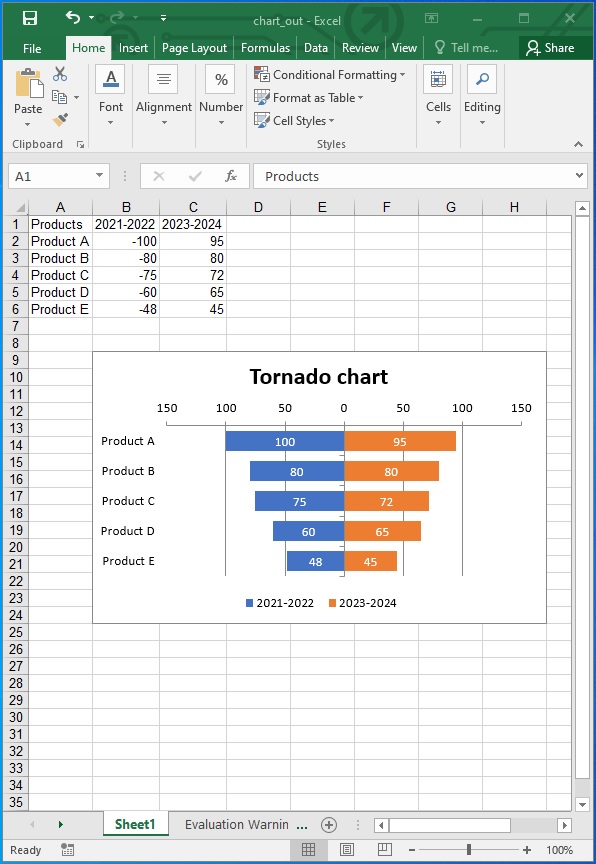
获取免费许可证
请获取免费的临时许可证,以便在 Excel 中创建龙卷风图表而不受试用限制。我们的 "临时许可证 "页面提供了简单易懂的说明,可让您立即获得免费许可证。
结论
在本文中,我们学习了如何使用 C# 在 Excel 中创建龙卷风图表。从在 Excel 工作表中插入数据到创建图表和设置图表属性,Aspose.Cells for .NET API 为数据可视化提供了一套全面的功能。按照本文概述的步骤,您可以轻松地将龙卷风图表集成到您的应用程序中。


 渝公网安备50010702505508