

在 v23.2 发布周期中,我们推出了一系列电子表格图表控件增强功能。我们已经在上一篇博文中介绍了误差条、旋转轴标签以及图表标题和轴标题的富文本格式: 电子表格文档 API、电子表格控件(Win 和 WPF)--图表增强功能(v23.2)。在本篇博文中,我将介绍如何为生成的图表对象应用现有的 Excel 图表模板(.crtx 文件)。
如您所知,CRTX 是一种描述图表内容的特殊文件格式。它是一个 XML 文件包,其中存储了颜色、坐标轴、序列、网格线、类别、图例、文本和其他图表设置/选项。您可以在 Microsoft Excel、Outlook、PowerPoint 或 Word 中将自定义图表布局保存为图表模板文件(.crtx)。单击图表时选择 "另存为模板 "命令,并为图表模板文件指定名称/位置。保存后,您可以在不同的机器/应用程序中共享模板,以应用您设计的图表外观。
我们用新方法扩展了电子表格文档 API,使您可以从图表模板文件导入和应用图表设置。AddFromTemplate 方法可从模板创建图表。LoadTemplate 方法将模板设置应用到现有图表。通过这一新功能,您可以将图表(保存为模板)作为其他类似图表的基础,或将预定义的图表样式应用于文档中的所有图表。
以下示例创建了两个图表,并使用 LoadTemplate 和 AddFromTemplate 方法应用了模板中存储的设置。
// ...
spreadsheetControl1.LoadDocument("Document.xlsx");
IWorkbook workbook = spreadsheetControl1.Document;
workbook.Worksheets.ActiveWorksheet = workbook.Worksheets["Sheet2"];
// Create a chart, bind it to data, and locate in a Worksheet.
DevExpress.Spreadsheet.Charts.Chart chartProductSales = spreadsheetControl1.ActiveWorksheet.Charts.Add(ChartType.ColumnClustered);
chartProductSales.TopLeftCell = spreadsheetControl1.ActiveWorksheet.Cells["F1"];
chartProductSales.BottomRightCell = spreadsheetControl1.ActiveWorksheet.Cells["K12"];
chartProductSales.Series.Add(spreadsheetControl1.ActiveWorksheet["A1:A4"], spreadsheetControl1.ActiveWorksheet["B1:B4"]);
// Specify title settings.
chartProductSales.Title.SetValue("Sales by Products");
chartProductSales.Title.Font.Italic = true;
// Create a chart, bind it to data, and locate in a Worksheet.
DevExpress.Spreadsheet.Charts.Chart chartSalesbyRegion = spreadsheetControl1.ActiveWorksheet.Charts.Add(ChartType.ColumnClustered);
chartSalesbyRegion.TopLeftCell = spreadsheetControl1.ActiveWorksheet.Cells["F14"];
chartSalesbyRegion.BottomRightCell = spreadsheetControl1.ActiveWorksheet.Cells["K26"];
chartSalesbyRegion.Series.Add(spreadsheetControl1.ActiveWorksheet["C1:C10"], spreadsheetControl1.ActiveWorksheet["D1:D10"]);
// Specify title settings.
chartSalesbyRegion.Title.SetValue("Sales by Region");
chartSalesbyRegion.Title.Font.Italic = true;
生成的图表显示如下
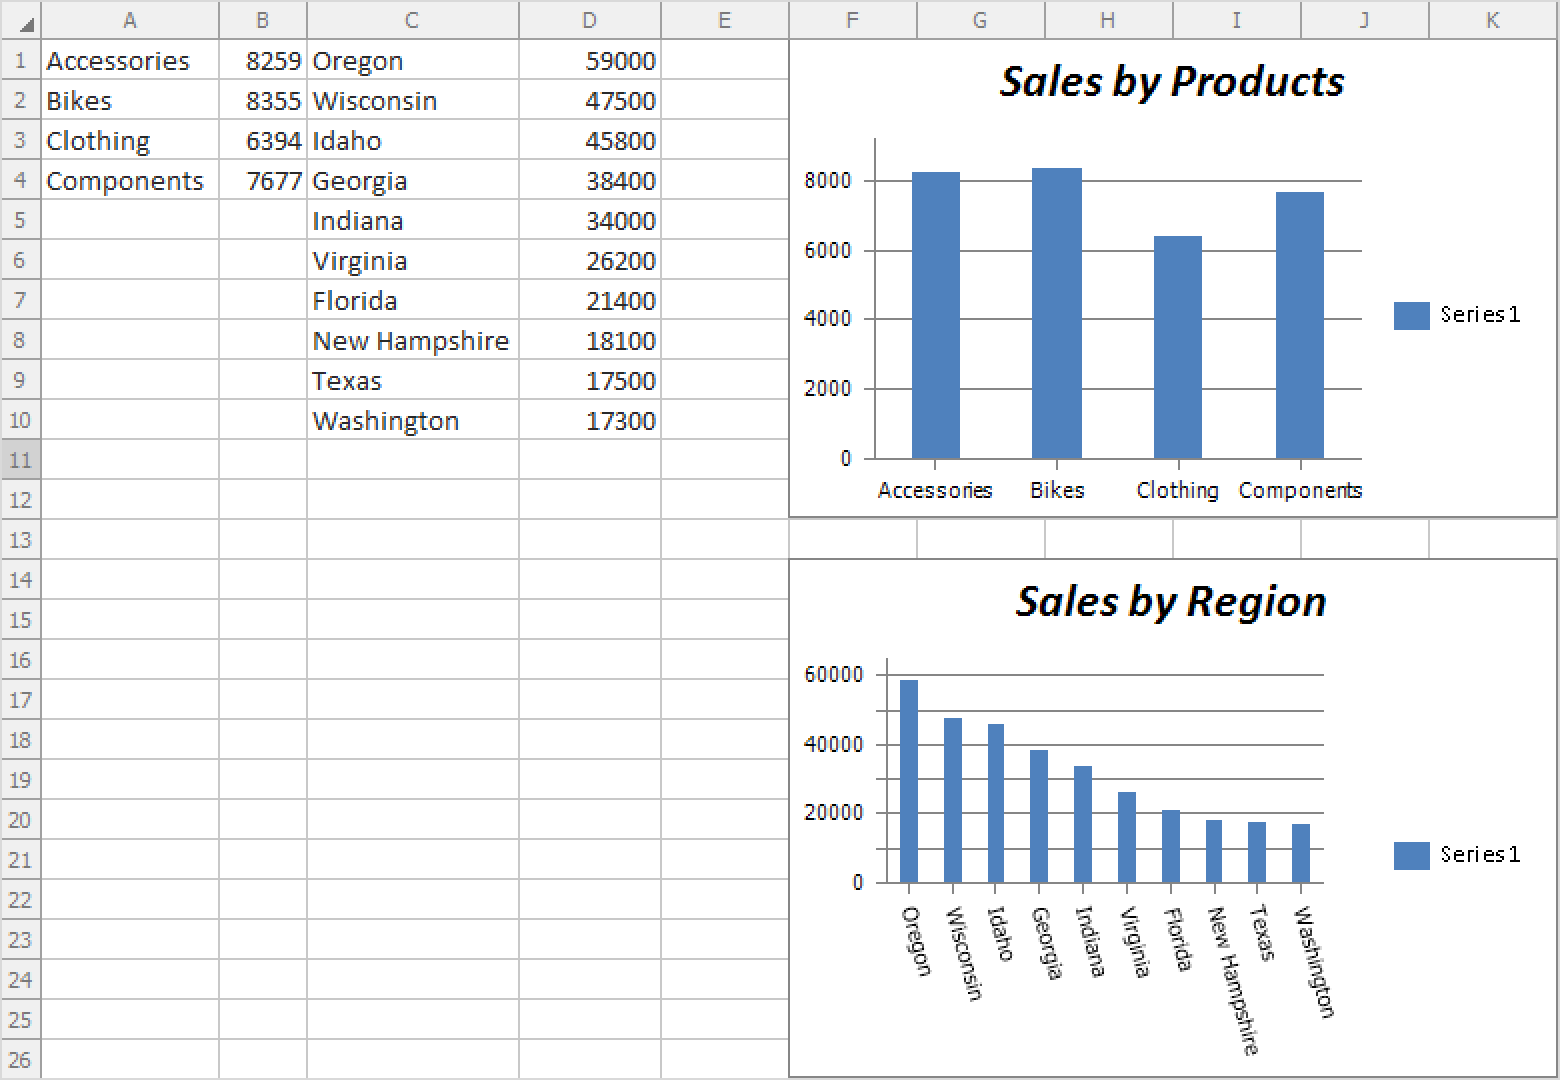
调用 LoadTemplate() 方法将图表模板设置应用到生成的图表中:
using (FileStream stream = new FileStream("Chart1.crtx", FileMode.Open)) {
foreach (var chart in spreadsheetControl1.ActiveWorksheet.Charts) {
    stream.Position = 0;
        chart.LoadTemplate(stream);
    }
}
输出结果如下
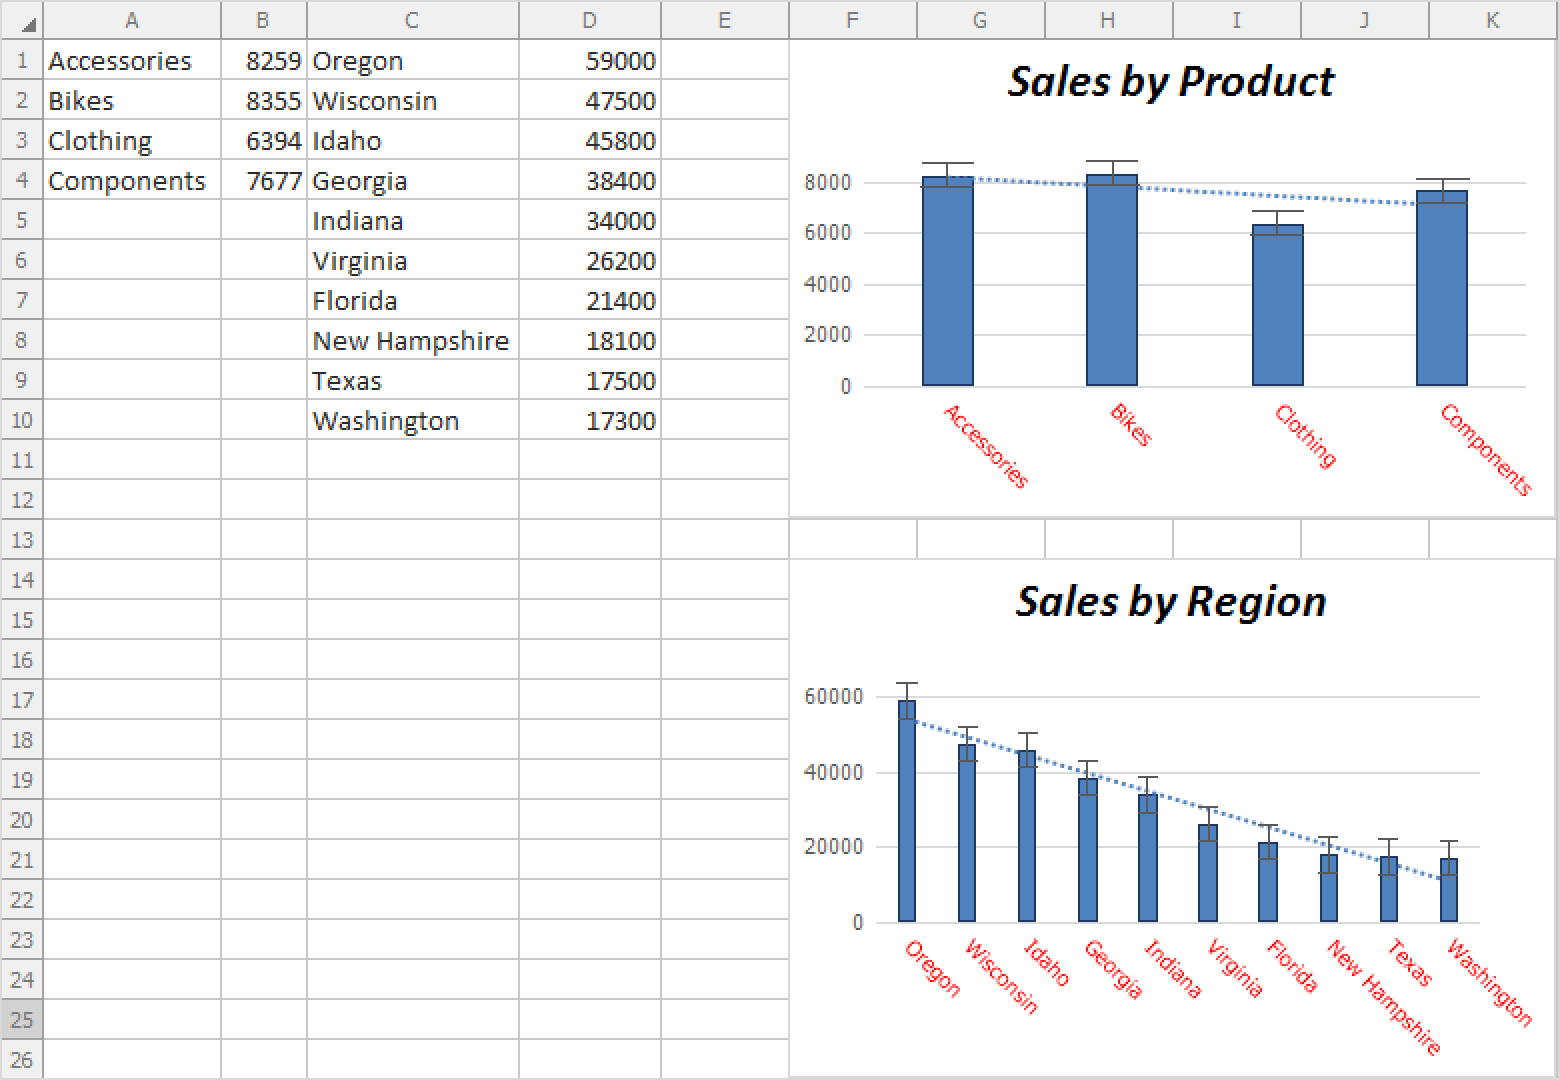
要使用 AddFromTemplate() 实现相同的结果,请执行以下代码片段。在这种情况下,您无需在应用模板设置之前创建图表对象:
// ...
spreadsheetControl1.LoadDocument("Document.xlsx");
IWorkbook workbook = spreadsheetControl1.Document;
workbook.Worksheets.ActiveWorksheet = workbook.Worksheets["Sheet2"];
using (FileStream stream = new FileStream("Chart1.crtx", FileMode.Open)){
    stream.Position = 0;
    // Create a new chart object, bind it to data, and apply template setitngs.
    var chartProductSales = spreadsheetControl1.ActiveWorksheet.Charts.AddFromTemplate(stream, spreadsheetControl1.ActiveWorksheet["A1:B4"]);
    // Locate the chart in a Worksheet.
    spreadsheetControl1.ActiveWorksheet.Charts[0].TopLeftCell = spreadsheetControl1.ActiveWorksheet.Cells["F1"];
    spreadsheetControl1.ActiveWorksheet.Charts[0].BottomRightCell = spreadsheetControl1.ActiveWorksheet.Cells["K12"];
    // Specify title settings.
    spreadsheetControl1.ActiveWorksheet.Charts[0].Title.SetValue("Sales by Product");
    spreadsheetControl1.ActiveWorksheet.Charts[0].Title.Font.Italic = true;
    stream.Position = 0;
    // Create a new chart object, bind it to data, and apply template setitngs.
    var chartSalesbyRegion = spreadsheetControl1.ActiveWorksheet.Charts.AddFromTemplate(stream,
    spreadsheetControl1.ActiveWorksheet["C1:D10"]);
    // Locate the chart in a Worksheet.
    spreadsheetControl1.ActiveWorksheet.Charts[1].TopLeftCell = spreadsheetControl1.ActiveWorksheet.Cells["F14"];
    spreadsheetControl1.ActiveWorksheet.Charts[1].BottomRightCell = spreadsheetControl1.ActiveWorksheet.Cells["K26"];
    // Specify title settings.
    spreadsheetControl1.ActiveWorksheet.Charts[1].Title.SetValue("Sales by Region");
    spreadsheetControl1.ActiveWorksheet.Charts[1].Title.Font.Italic = true;
}
正如您所看到的,我们的新方法简化了图表生成过程--消除了每个图表对象的重复。


 渝公网安备50010702505508