

史密斯圆图
史密斯圆图是为研究和解决传输线问题而设计的图表。此图适用于无线电频率专业的电气和电子工程师。这些类型的图表在大多数射频电路分析软件中都很常见。
今天,我们将使用 LightningChart .NET 工具构建史密斯圆图教程的交互式示例。我们将从简单介绍LightningChart框架的下载安装和交互示例的应用开始。
项目概况
今天,我们将展示如何使用 LightningChart .NET 开发交互式史密斯圆图应用程序。与之前的 .NET 文章类似,我们将从设置您的 LightningChart .NET 许可证、在 Visual Studio 中设置项目以及运行最终应用程序逐步进行。
值得一提的是,LightningChart .NET 提供了几个 UI 元素,您可以稍后根据自己的喜好对其进行自定义。
话虽如此,让我们看看您将创建什么:

下载项目
本地设置
对于这个项目,我们需要考虑以下需求来编译项目。
操作系统:32 位或 64 位 Windows Vista 或更高版本,Windows Server 2008 R2 或更高版本。
DirectX:9.0c(着色器模型 3 及更高版本)或 11.0 兼容图形适配器。
Visual Studio:2010-2019 用于开发,不需要部署。
平台 .NET Framework:已安装 4.0 或更新版本。
现在转到产品页面下载安装包: https://www.dhorde.com/product/82.html
安装完成后,您将可以访问您自己的 LightningChart 帐户。

登录帐户后,您将能够下载 SDK。此 SDK 将是一个“免费试用”版本,但您将能够使用许多重要功能。
如果您下载 SDK,您将拥有一个如下所示的 .exe:

安装将是一个典型的 Windows 过程,所以请继续安装直到完成。安装后,您将看到以下程序:

许可证管理器:如需购买,请联系我们。您将使用此试用版 SDK 创建的所有项目都将可用于启用所有功能的未来开发。

LightningChart .NET 交互式示例:现在您可以看到 100 多种可用于 WPF、WinForms 和/或 UWP 的交互式可视化,尽管今天我们使用的是史密斯圆图。

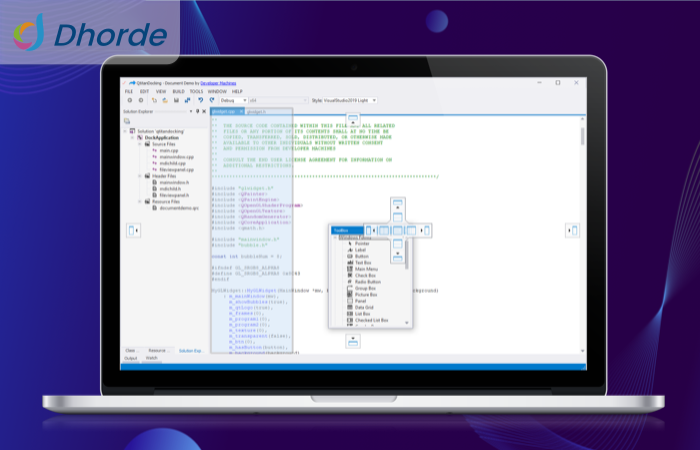
Visual Studio 项目
现在让我们使用 visual studio。使用 LightningChart .NET 可视化工具和 Visual Studio 的主要区别在于,我们将能够分析和试验源代码中的许多功能。在 LC 可视化工具中,选择 Smith 折线图并运行示例:

在窗口的右上角区域,您将看到以下选项:

对于试用版 SDK,我们将能够使用 WPF 和 WinForms 框架。如果您完全与 Windows 窗体相关,则此选项会更舒服。在本例中,我将使用 Windows Presentation Foundation 框架。
单击要使用的框架后,我们需要指定一个将创建项目的文件夹:

最后,将创建项目,并打开 Visual Studio 并准备执行。

代码审查
主要代码将包装在MainWindow.xaml.cs中。在这里我们将找到 UI 控件的代码。

在代码中,我们将检查两种方法,这两种方法将创建正确绘制图表所需的属性。
创建图表
此主要方法将初始化 Lightning Chart .NET 框架提供的许多属性。如果你看过我们之前的JS 文章,这部分会很熟悉。
这里的最大优势是,如果您有 C# 知识,这种语法对您来说会更容易。
_chart:图表对象将包含 Lightning Chart 构造函数……基本上,这将包含图表对象的新实例。
_chart——属性:
// Create a new chart.
_chart = new LightningChart();
// Disable rendering, strongly recommended before updating chart properties.
_chart.BeginUpdate();
// Set optional name for the chart.
_chart.ChartName = "Smith line chart";
_chart.ActiveView = ActiveView.ViewSmith;
_chart.ViewSmith.ZoomPanOptions.ZoomPadding = new Thickness(10, 30, 10, 10);
BeginUpdate():在更新许多属性的状态或更新系列点时禁用控件重绘。
ChartName:图表的名称。
ActiveView:通过从枚举类中选择史密斯图表来指定图表类型。
ZoomPadding:填充影响缩放操作。缩放区域和边距之间的空白区域。
//Add a line series
PointLineSeriesSmith series = new PointLineSeriesSmith(_chart.ViewSmith, _chart.ViewSmith.Axis)
{
PointsVisible = true
};
series.PointStyle.Color1 = series.LineStyle.Color;
series.Title.Text = "System output impedance";
_chart.ViewSmith.PointLineSeries.Add(series);series:PointLineSeriesSmith 的实例,它将包含图表视图中所有点的属性。
PointsVisible:显示图表中的点。
添加:数据点的所有属性(系列实例类)将添加到点线系列。
创建数据点:要将点添加到史密斯图表,我们需要为结构SmithSeriesPoint创建一个数组对象。该结构需要 2 个或 3 个参数(real、imgValue、tag):
real : 双重类型。真正的组件。
imgValue : Double 类型。史密斯圆图坐标的虚部。
标签:对象类型。可自由分配的对象。
SmithSeriesPoint[] dataPoints = new SmithSeriesPoint[] {
new SmithSeriesPoint(70, 60, 10000),
new SmithSeriesPoint(55, 45, 15000),
new SmithSeriesPoint(45, 37.5, 20000),
new SmithSeriesPoint(37.5, 30, 25000),
new SmithSeriesPoint(30, 22, 30000),
new SmithSeriesPoint(24, 14, 35000),
new SmithSeriesPoint(21, 9, 40000),
new SmithSeriesPoint(17.5, 3, 45000),
new SmithSeriesPoint(14.5, -3, 50000),
new SmithSeriesPoint(13.5, -9, 55000),
new SmithSeriesPoint(14, -15, 60000),
new SmithSeriesPoint(15, -20, 65000),
new SmithSeriesPoint(17, -25, 70000),
new SmithSeriesPoint(18, -30, 75000),
new SmithSeriesPoint(20, -37.5, 80000),
new SmithSeriesPoint(22, -45, 85000),
};
series.Points = dataPoints;dataPoints数组需要分配给系列类中的Points数组。
创建一个标记作为数据值解析游标
PointShapeStyle pss = new PointShapeStyle(null);
EventMarkerTitle title = new EventMarkerTitle(null)
{
Color = Colors.Red,
Text = "Cursor"
};
_cursor = new SmithEventMarker(_chart.ViewSmith, _chart.ViewSmith.Axis, pss,
1, 0.5, title, new PointInt(0, 0))
{
SnapToClosestPoint = RoundEventMarkerBase.MarkerSnapToType.All
};
_cursor.SetSnapSeries(series);
_cursor.Label.Font = new WpfFont("Segoe UI", 16, true, false);
_cursor.Label.Shadow.Style = TextShadowStyle.HighContrast;
_cursor.Label.Color = Color.FromArgb(255, 192, 0, 0);
_cursor.Symbol.Width = _cursor.Symbol.Height = 17;
_cursor.Symbol.BorderWidth = 2;
_cursor.Symbol.BorderColor = Colors.Red;
_cursor.Symbol.Color1 = Colors.Transparent;
_cursor.Symbol.Color2 = Color.FromArgb(100, 255, 0, 0);
_cursor.PositionChanged += Cursor_PositionChanged;
_cursor.Symbol.Shape = Arction.Wpf.Charting.Shape.Circle;
_cursor.RealValue = dataPoints[2].RealValue;
_cursor.ImgValue = dataPoints[2].ImgValue;
正如我们在上面的代码中看到的,我们可以为光标分配样式属性。所有的值都是基本的 UI 概念,如果你想检查其余的属性,请转到API 文档页面。
向图表添加坐标轴属性:
ReferenceValue:归一化值是绝对值/参考阻抗(欧姆)。
ShowAbsoluteValues:确定轴是显示绝对值还是标准化值。
AxisThickness:轴线的粗细。
GridImg:实部网格的网格线选项。
GridReal:实部网格的网格线选项。
LegendBox:显示系列的描述。
_chart.ViewSmith.Axis.ReferenceValue = 50; //ohms
_chart.ViewSmith.Axis.ShowAbsoluteValues = true;
_chart.ViewSmith.Axis.AxisThickness = 2;
_chart.ViewSmith.Axis.Title.Visible = false;
_chart.ViewSmith.Axis.GridImg.LineWidth = 1.1f;
_chart.ViewSmith.Axis.GridReal.LineWidth = 1.1f;
_chart.ViewSmith.LegendBox.ShowCheckboxes = false;
gridChart.Children.Add(_chart);
//Allow chart rendering
_chart.EndUpdate();
gridChart: XAML 网格对象。
<Grid Grid.Row="1" Name="gridChart">
EndUpdate():启用控件重绘。
更新游标:
private void Cursor_PositionChanged(object sender, SmithPositionChangedEventArgs e)
{
UpdateCursorText(e.NewPosition.RealValue, e.NewPosition.ImgValue);
}
/// <summary>
        /// Update cursor text
        /// </summary>
        /// <param name="real">Real value</param>
        /// <param name="img">Imaginary value</param>
        private void UpdateCursorText(double real, double img)
{
if (_chart != null)
{
_chart.BeginUpdate();
string strSign = "+";
if (img < 0)
{
strSign = "-";
}
if (radioButtonNormalizedScale.IsChecked == true)
{
double dNormalizedReal = real / _chart.ViewSmith.Axis.ReferenceValue;
double dNormalizedImg = img / _chart.ViewSmith.Axis.ReferenceValue;
_cursor.Label.Text = "Z = " + dNormalizedReal.ToString("0.00") + " " + strSign + " j" + Math.Abs(dNormalizedImg).ToString("0.00");
}
else
{
_cursor.Label.Text = "Z = " + real.ToString("0.0") + " " + strSign + " j" + Math.Abs(img).ToString("0.0") + "Ω";
}
_chart.EndUpdate();
}
}
每次光标改变其位置时,都会调用[UpdateCursorText] 。真正的double值和IMG值会除以当前轴的最大值。
文本会将结果转换为字符串(因为标签需要字符串)。如果选择[Normalized Scale]的单选按钮,所有这些属性都将起作用。
单选按钮:
private void RadioButtonCheckedChanged(object sender, RoutedEventArgs e)
{
if (_chart == null)
{
return;
}
_chart.BeginUpdate();
if (radioButtonAbsoluteScale.IsChecked == true)
{
_chart.ViewSmith.Axis.ShowAbsoluteValues = true;
}
else
{
_chart.ViewSmith.Axis.ShowAbsoluteValues = false;
}
UpdateCursorText(_cursor.RealValue, _cursor.ImgValue);
_chart.EndUpdate();
}
如果选中绝对值,这将确定轴显示的是绝对值还是标准化值。[ UpdateCursorText]将被再次调用,因为这取决于绘制网格的检查值。
处置:
public void Dispose()
{
// Don't forget to clear chart grid child list.
gridChart.Children.Clear();
if (_chart != null)
{
_chart.Dispose();
_chart = null;
}
// Disposing of unmanaged resources done.
}
如果您需要停止线程、处置非托管资源或需要在此示例对象为垃圾收集器准备好之前完成的任何其他作业,请调用此方法。
最后
我们现在已经了解了如何创建用于阻抗表示的众多高级史密斯圆图示例之一。作为史密斯圆图基础知识的一部分,史密斯圆图工具可以帮助轻松识别任何其他阻抗失配。如图所示,这是用于无线电频率和微波领域研究的工程图表。
LightningChart .NET 通过提供易于开发和实施的高性能史密斯图表来缩短开发时间。呈现的 Smith 圆图包括带有数据光标的绝对刻度和标准化刻度,这两种功能都可以使用 UI 元素轻松打开/关闭。
此图表与 LightningChart .NET 中的 WPF、UWP 和 WinForms 的 100 多个其他图表组件一起使用。其他图表类型包括 XY 图表、LineSeries、热图等。


 渝公网安备50010702505508